In the Reports module, in the Dashboards pages, users will be able to create widgets using the following widget / report types.
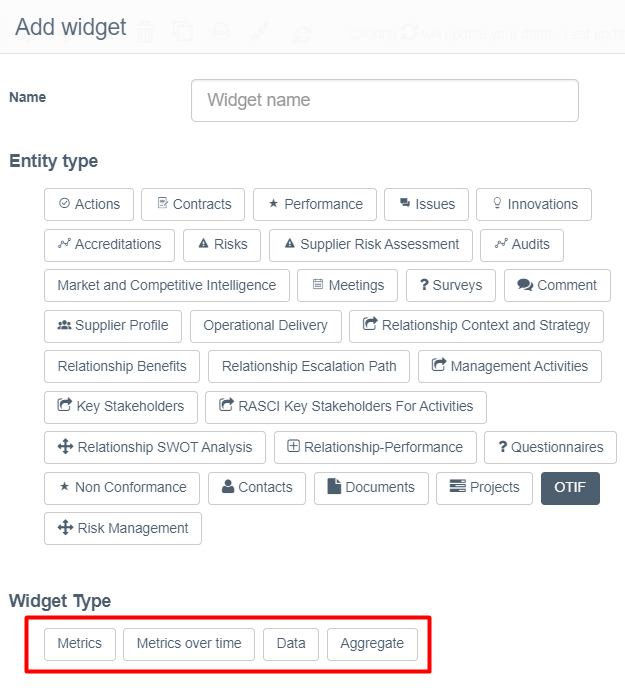
Metric widgets
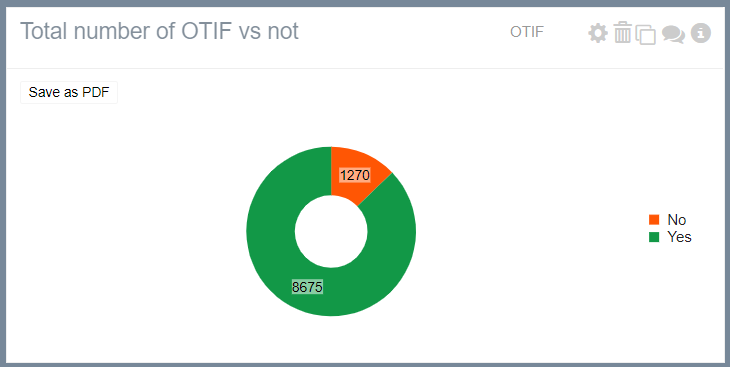
These provide users with the ability to select one (1) field e.g. supplier, plant, region and produce the statistics, number or percentage, of OTIF records based on that one (1) field.
- Select entity: OTIF
- Select widget type: Metrics
- Select display type: Bar, Column, Pie, Donut, Grid, Radar
- Select column (field): Supplier or Supplier Entity or Business Unit or Plant or In Full %, or On Time %, or OTIF %
- Select column (field) filters: Supplier, Supplier Entity, Business Unit, Plant, In Full %, On Time %, OTIF %
- Select Date Filters: Delivery Date
Example reports
Number / Percentage of OTIF % = 100% vs. OTIF % = % deliveries in Plant
Number / Percentage of OTIF % = 0% deliveries by Plant in Business Unit X
Number / Percentage of OTIF % = 0% deliveries by supplier in Plant X
Metrics over time
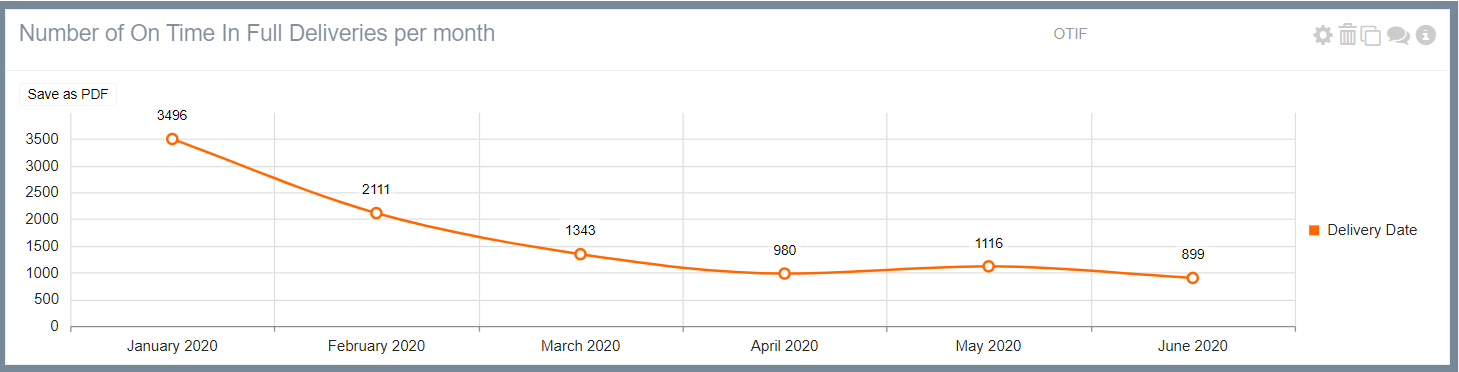
These provide users with the ability to select one (1) date field and produce the statistics, number of percentage, of OTIF records over time.
- Select entity: OTIF
- Select widget type: Metrics over time
- Select display type: Bar, Column, Pie, Donut, Radar
- Select date (field): Supplier or Supplier Entity or Business Unit or Plant or In Full %, or On Time %, or OTIF %
- Select column (field) filters: Supplier, Supplier Entity, Business Unit, Plant, In Full %, On Time %, OTIF %
- Select date filters: Delivery Date
Example reports
Number of OTIF % = 0% deliveries in Plant = Botany, over time
Number of OTIF % = 0% deliveries by Plant in Business Unit X, over time
Number of OTIF % = 0% deliveries by supplier in Plant X, over time
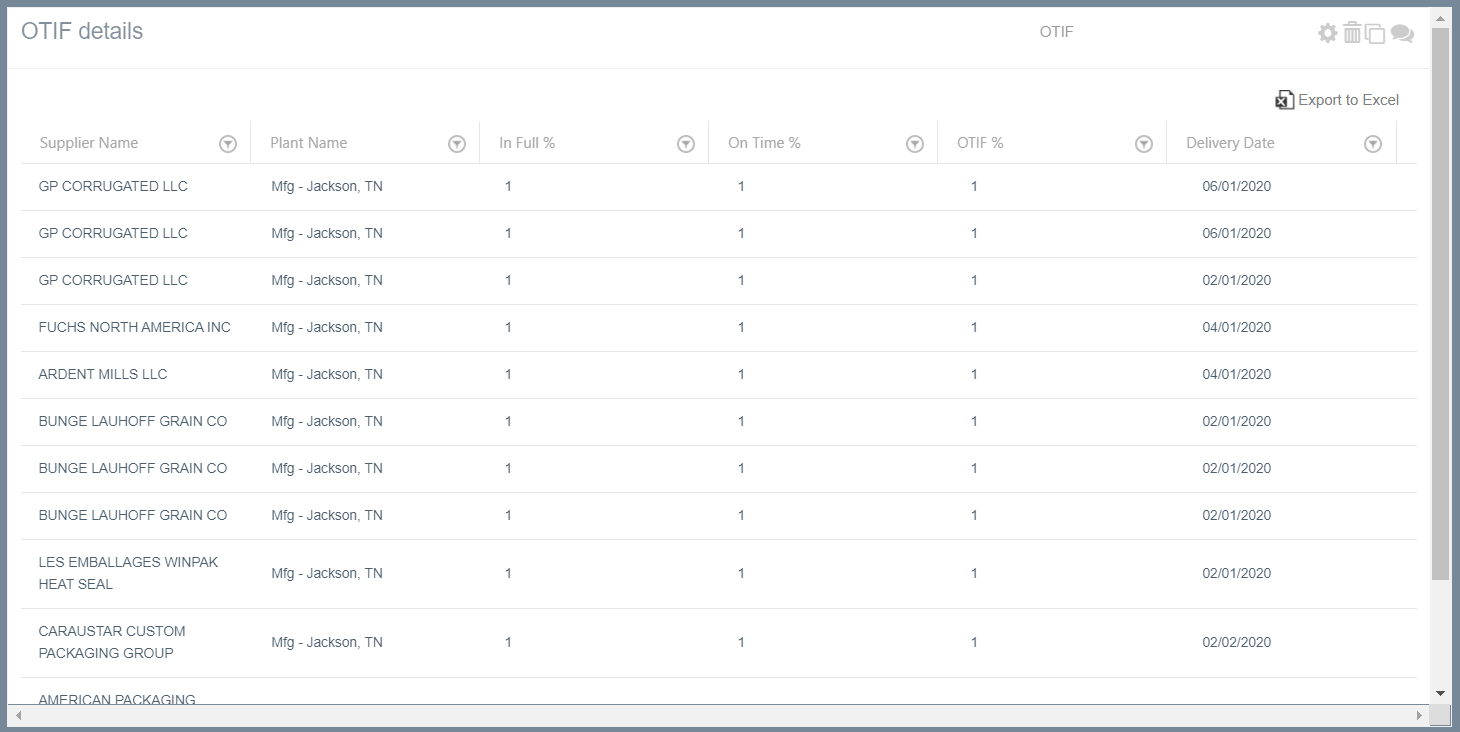
Data widgets
These provide users with the ability to select multiple fields and produce a data / grid of OTIF records (rows) showing the selected fields (columns).
There is ability to filter the OTIF records using any of the fields.
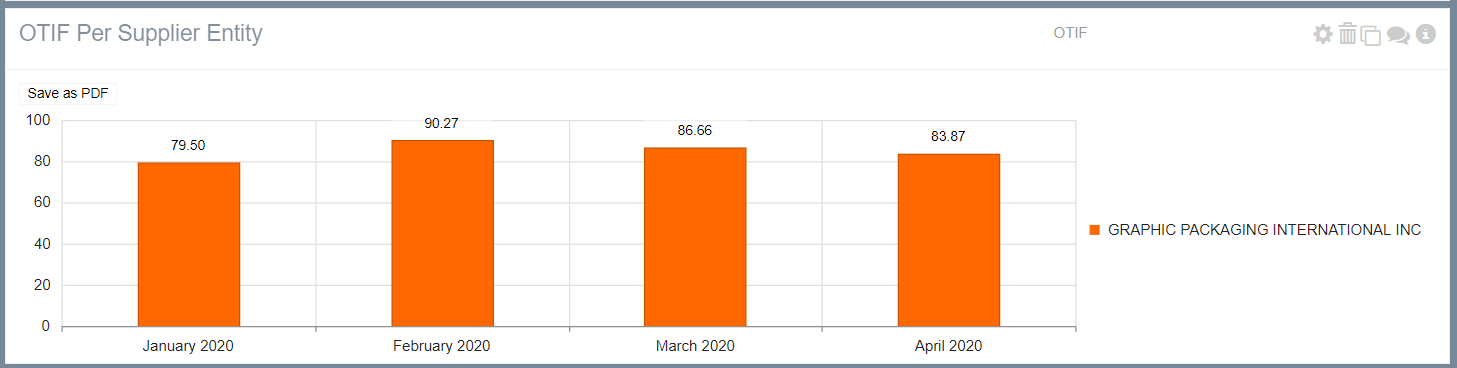
Aggregate widgets
These provide users with the ability to aggregate for one (1) selected field the granular OTIF records and calculate the rolled-up average OTIF % score, based on the selected:
- Select entity: OTIF
- Select widget type: Aggregate
- Select display type: Bar, Column, Grid, Line
- Select X axis: Supplier, Supplier Entity, Business Unit, Plant, Time
- Select Y axis: Supplier, Supplier Entity, Business Unit, Plant, Time
- Select column (field) filters: Supplier, Supplier Entity, Business Unit, Plant
- Select date filters:
Example reports
Aggregated OTIF of all suppliers, over time
Aggregated OTIF % of all suppliers in Plant X, over time
Aggregated OTIF % by plant in Business Unit X
Aggregated OTIF % by business unit in Month X
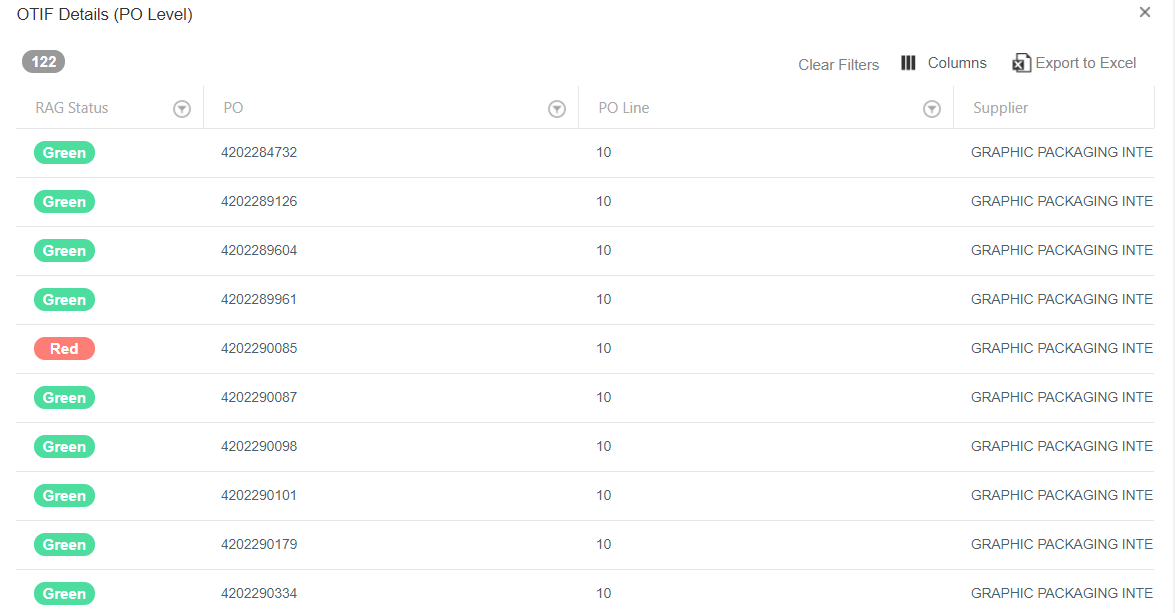
At the aggregate OTIF reports there is ability to drill-down on the OTIF data to access the OTIF records that make up an aggregated OTIF % score.
For example, if a user wants to view which records make up the monthly OTIF 79.8% for January, the user has to click on the January column. Once clicked, a pop-up will display a grid with the OTIF records that have been included in that report, as shown below.
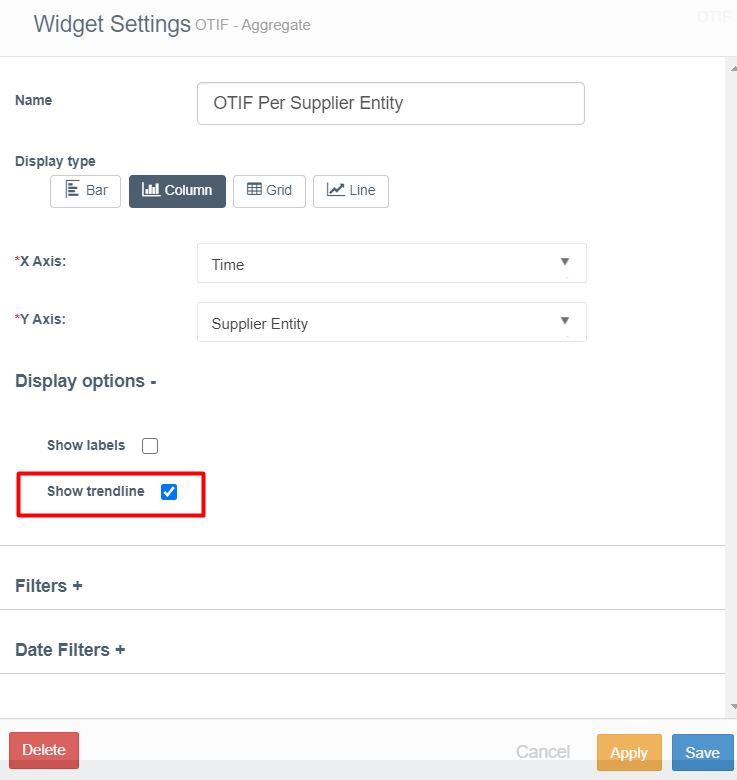
Ability to add a trend line in an OTIF aggregate widget
For widgets that have time in the X axis, a trend line can optionally be added by users.
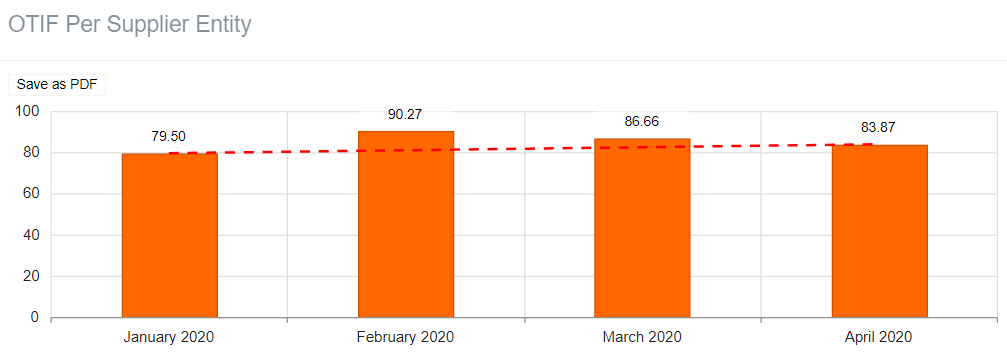
The option to add a trend line is available at the Display Options at the widget builder.