Introduction
The On Time In Full (OTIF) is a KPI which is intended to measure the efficiency and accuracy of the product delivery in supply chain.
It consists of two parts - on time & in full. It is used to measure a) the ability of a supplier to deliver the agreed products within a defined timeframe and b) the completeness and accuracy of the order.
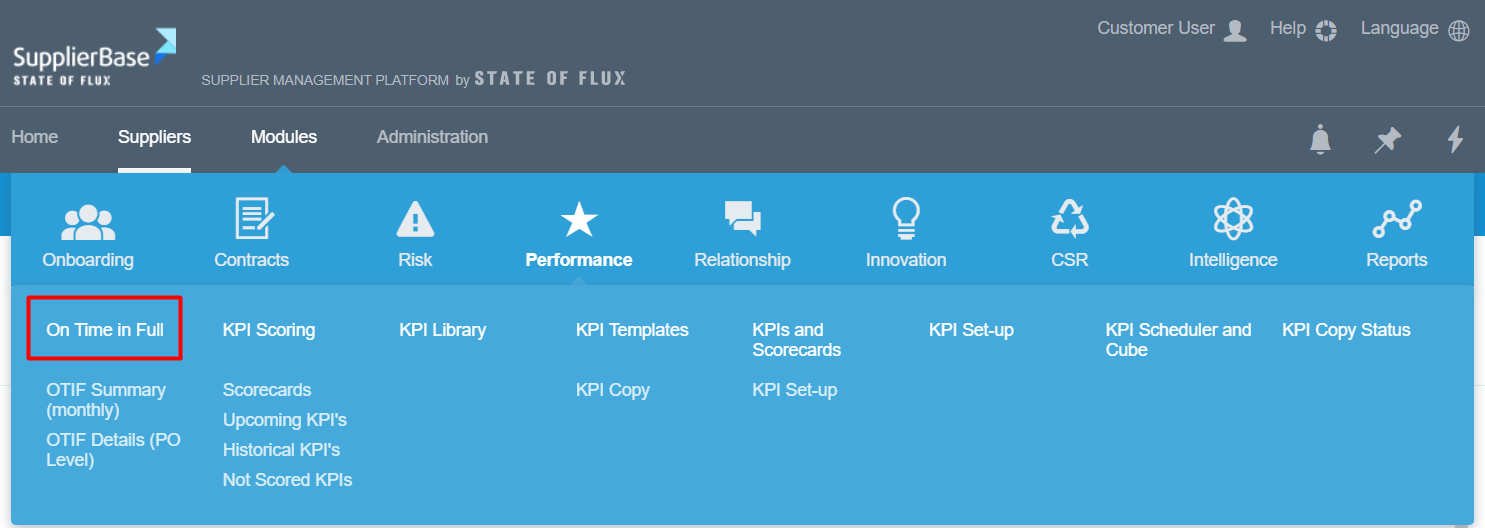
In SupplierBase, users can view uploaded OTIF data in the On Time In Full pages under the Performance module, in supplier and modular level.
Import of OTIF data
To upload OTIF data in SupplierBase, the following steps must be done:
a) The multiple supplier entities have to be mapped against the supplier that is created in the system. For example, there might be the mother company IBM, which will have 3 supplier entities responsible for different deliveries. To be able to measure OTIF against the mother company and all the deliveries, users have to link the supplier entities to the supplier record in SupplierBase.
For this the existing SAP ID field will be used in Administration > Suppliers page. System administrators must list all the supplier entities (free text, multiple codes comma separated) in the Supplier's page.
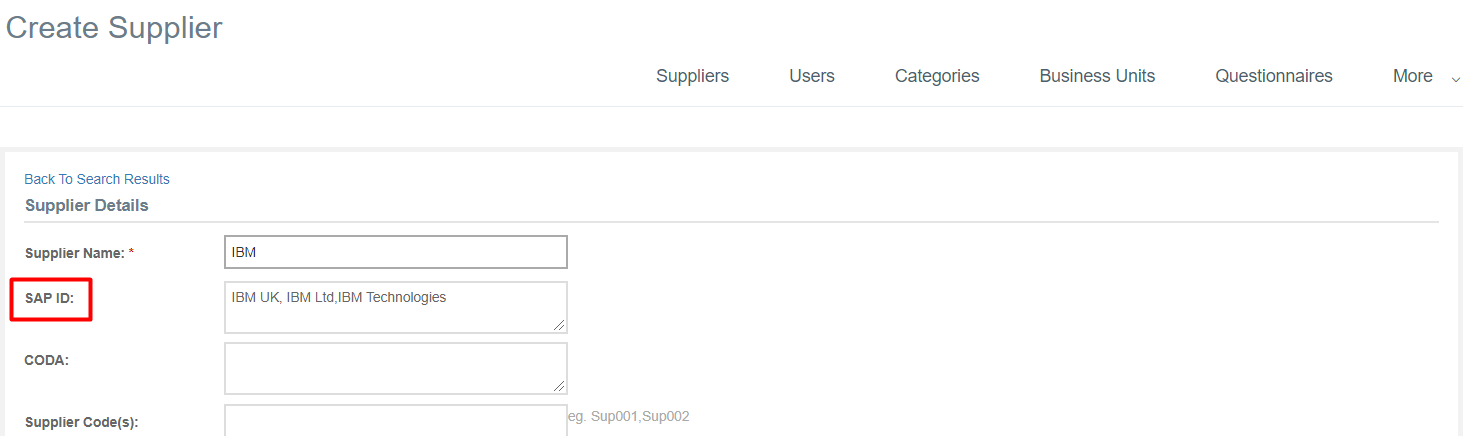
This will establish mapping (one to many) between potentially multiple suppliers (or supplier entities) in Keystone and one supplier (the parent company) at SupplierBase.
b) The client must populate the OTIF template with the raw data of the orders and the deliveries. The template contains the below fields:
- PO
- PO Line
- Material
- Supplier Entity (SAP)
- Plant
- Short Text
- Created Date
- First GR Date
- Delivery Date
- Business Unit
- LTA
- PO Qty
- GR Qty
- In Full %
- On Time %
- Planned Delivery Time
- OTIF%
- PO Value
- Currency
c) The customer would have to provide the template to the SupplierBase team to upload it from the back end to the platform. The customer can also publish the OTIF file into an SFTP location and provide the SupplierBase team with the SFTP location and the relevant credentials to be able to access reports at that location.
The imported file will create new records and update existing records (the PO and PO line make up the unique identifier or a record).
Display of OTIF data
Under the On Time In Full, there are two pages in which users can view the data: the OTIF Details (PO Level) and the OTIF Summary (monthly).
OTIF details (PO Level)
In this page, all the OTIF data on the Purchase Order level of all the suppliers aggregated per month. In this grid, users are able to view all the data that were imported and two more columns: Supplier and RAG Status (OTIF 100% = Green, OTIF 0% = Red).
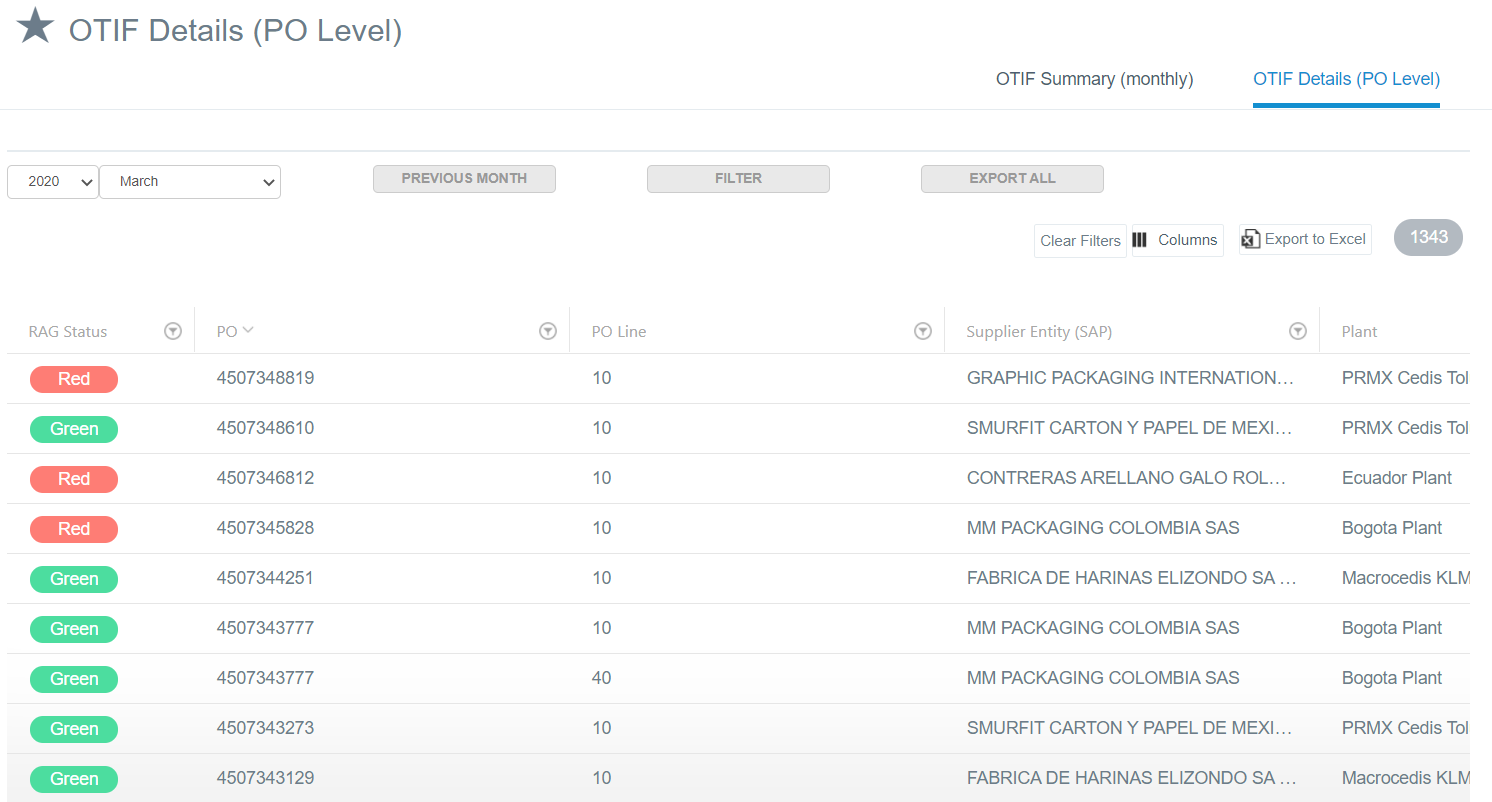
Basically users can view the for every order if it was delivered on time and in full. To locate a specific delivery, users would need to know the PO and PO Line numbers. The combination of these two makes up a unique identifier for every delivery.
Due to the number of records, users will have the ability to define the data they see in the grid (based on filters). By default, the current-month data will be initially displayed to the user.
On the grid, users will be able to perform the following standard activities:
- Filter
- Search
- Sort
- Export to Ms Excel
In every delivery row, users can:
- View OTIF details: at the View pop-up, users are able to view the details of a delivery
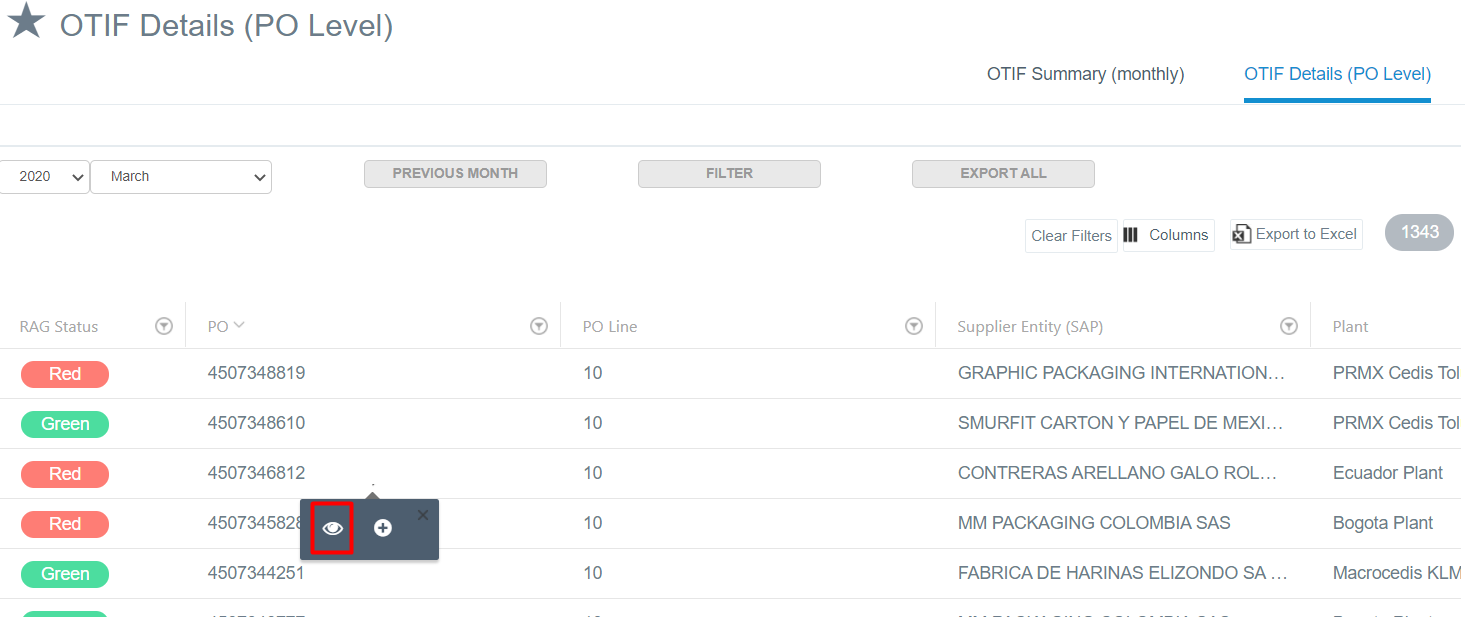
- Add OTIF actions
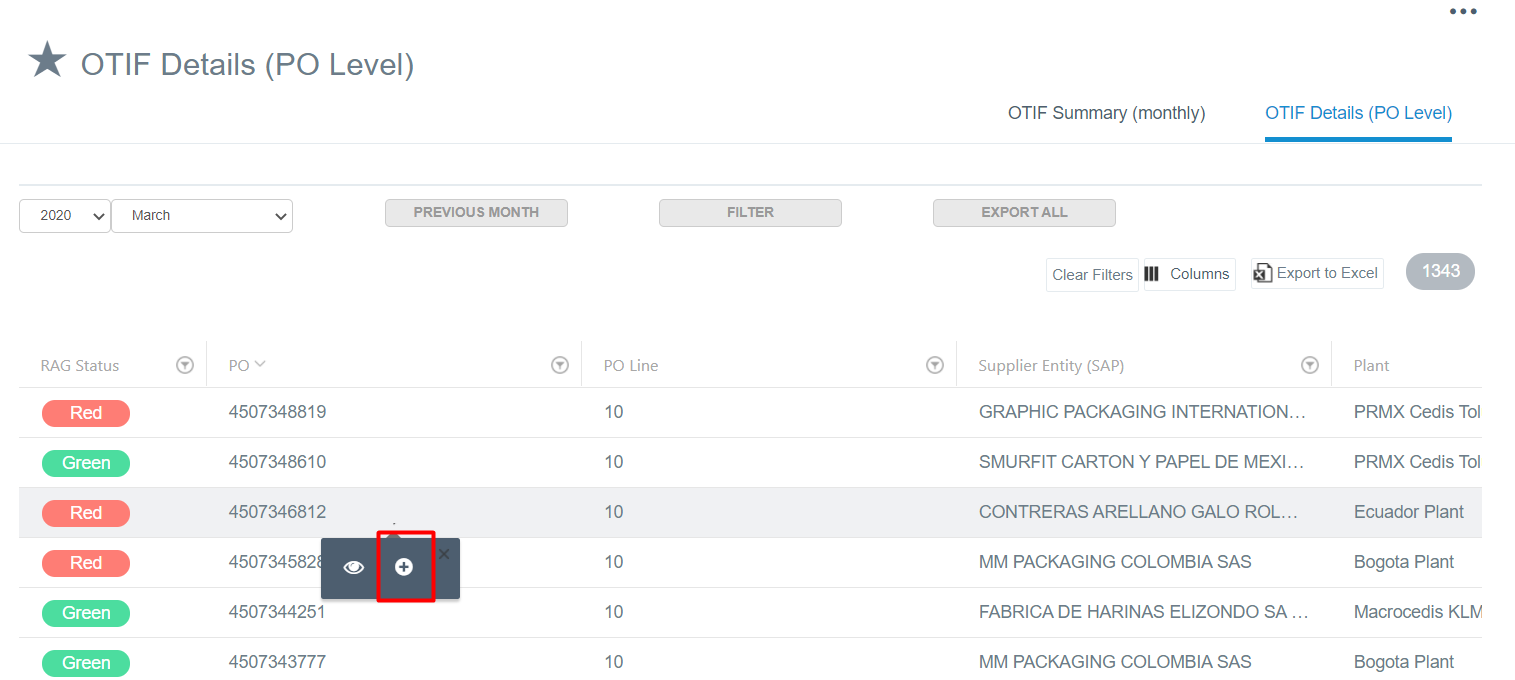
At the Add Action pop-up, the action type field will be prepopulated with the OTIF action type and in the OTIF field the unique identifier of the delivery (combination of PO and PO line) will be populated. This way the action will be linked with a specific delivery.
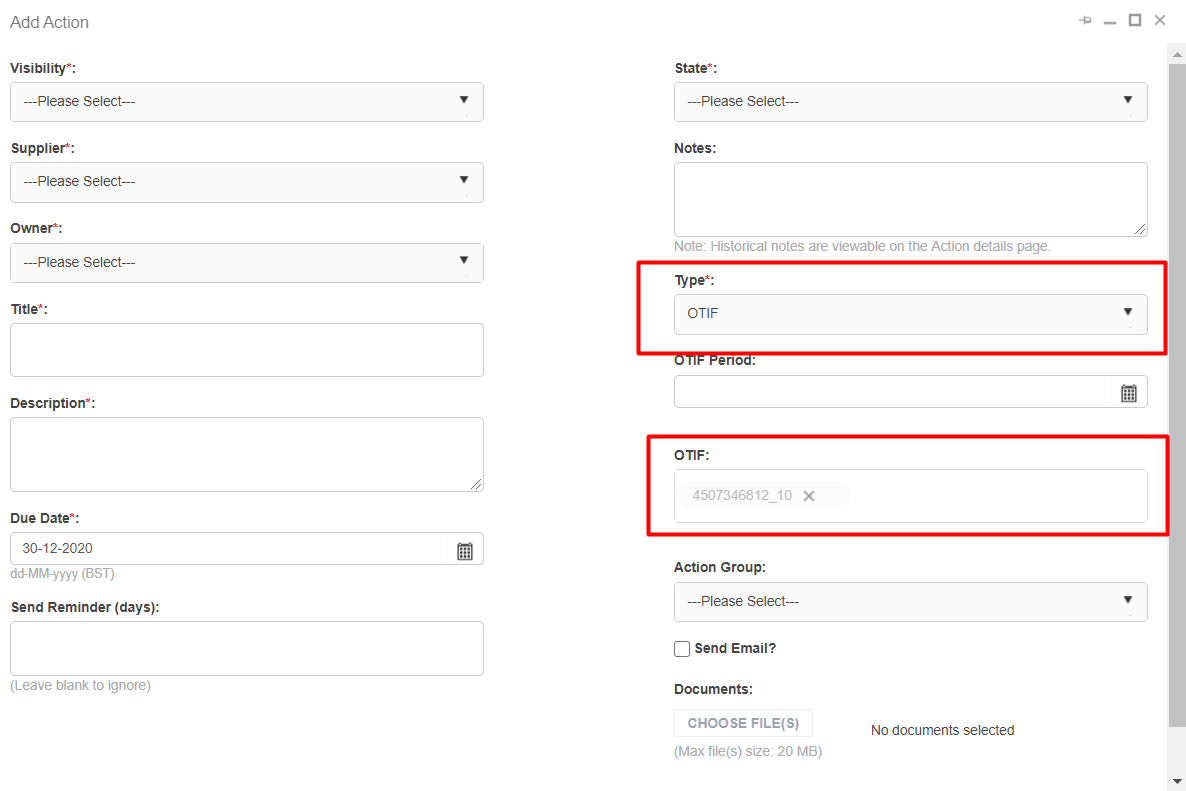
Additionally, when the action type = OTIF, a field called OTIF Period is displayed to provide users with the ability to define the month that a corrective action is relevant to. For example, if the supplier creates a corrective action for the low OTIF % score in May 2020, the user will be able to select May 2020 in the OTIF Period field, therefore linking a corrective action with the appropriate period.
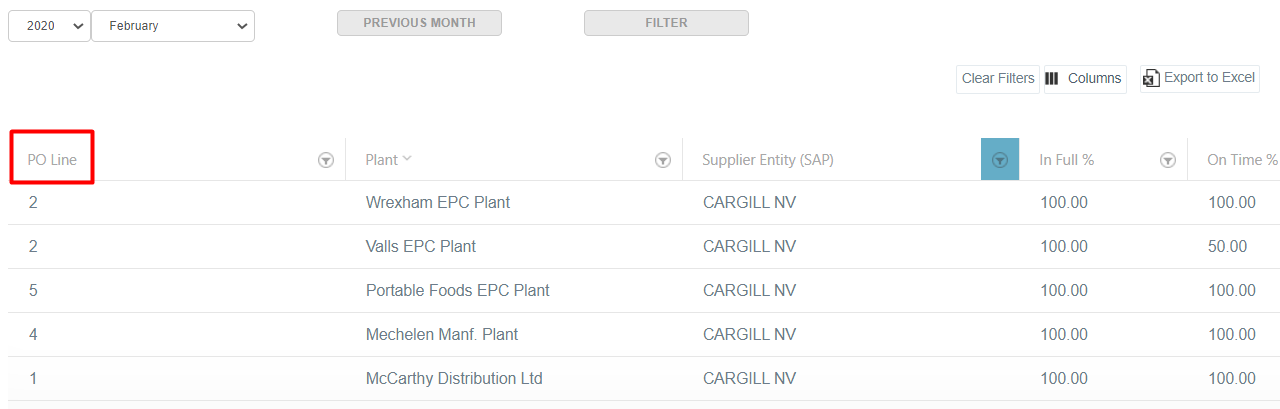
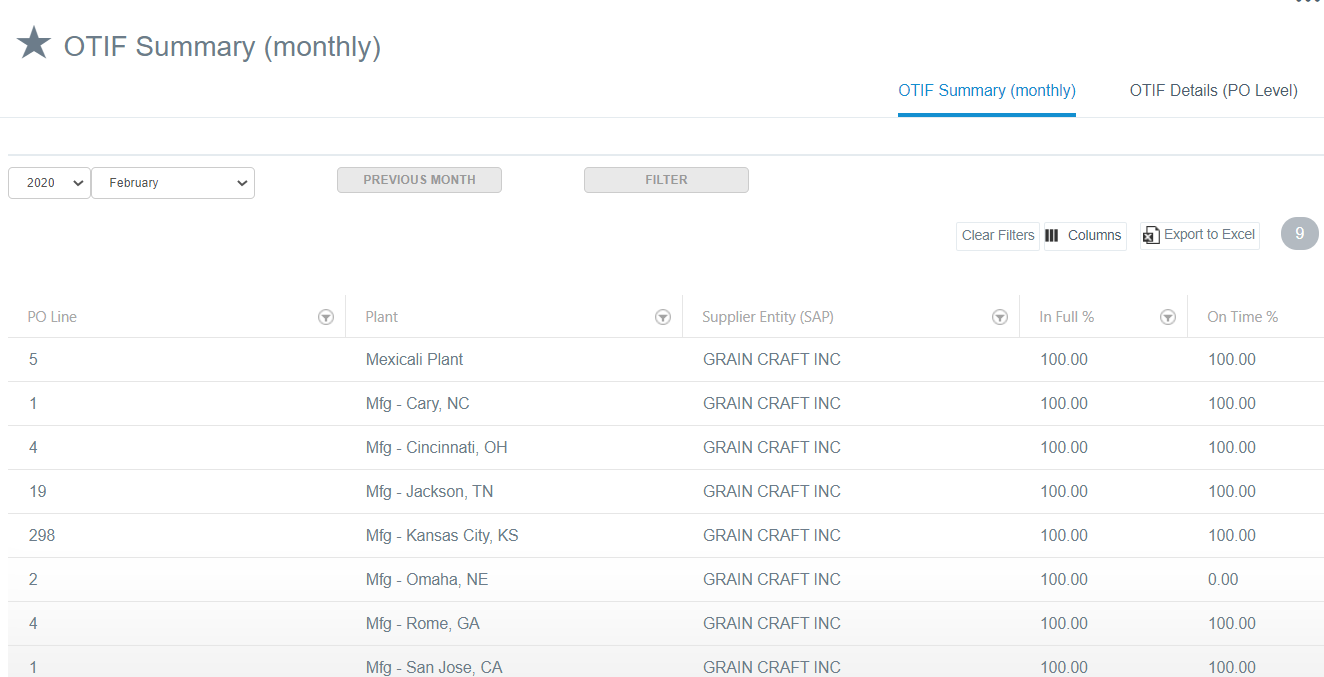
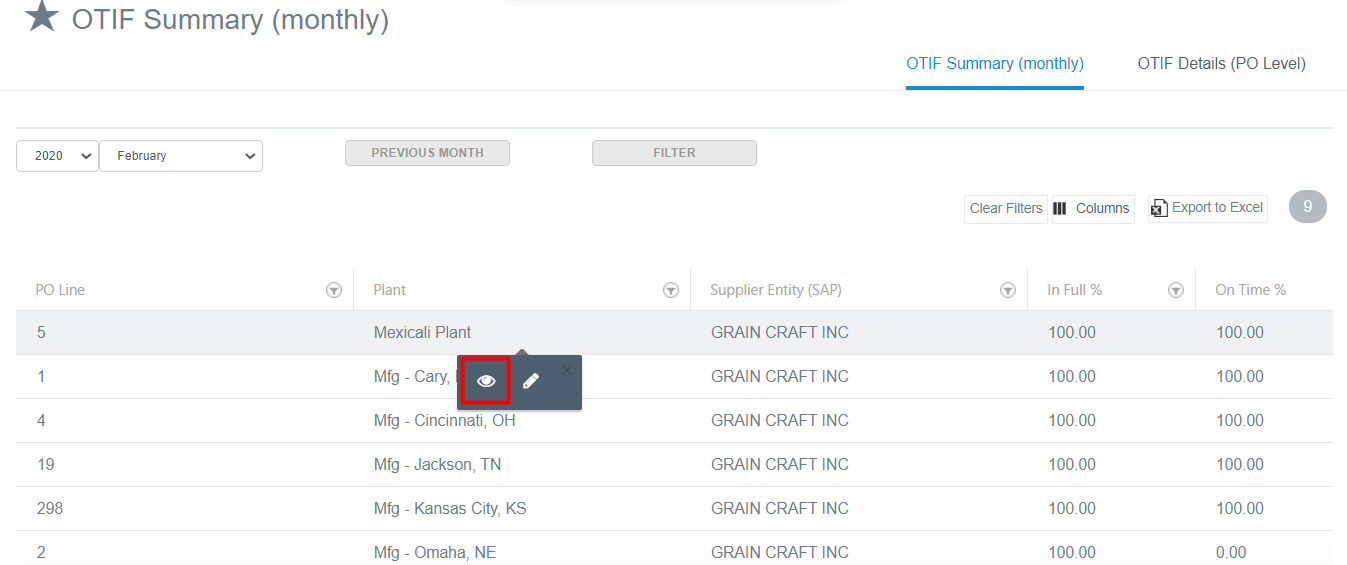
OTIF Summary (monthly)
The grid in this page summarises the OTIF data that have been imported in the PO level. The grid will by default display the OTIF data of the current-month. Users will be able to select the month that they want to display the data.
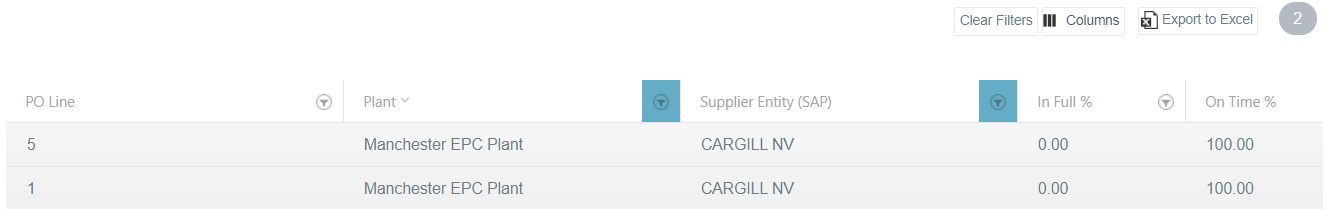
Each row of the table summarises the deliveries that have been made by a supplier entity to a plant in one month.
For example, in the below table the deliveries that are made by the Supplier Entity CARGILL NV to different plants are summarised. The column PO Line displays the number of POs that are included in the summary and can be viewed separately in the OTIF details page.
Exception:
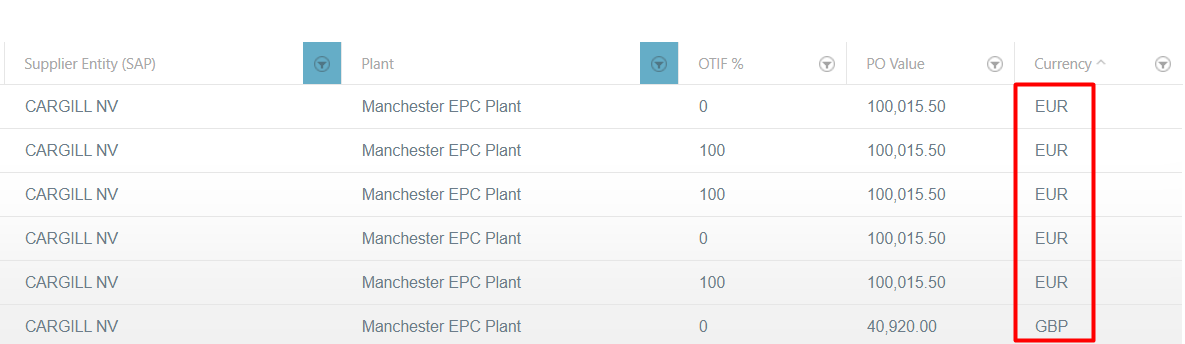
There might be some cases where the same combination of Supplier Entity and Plant have more return more than one rows in the grid.
The reason that this happens is because the orders are made in different currencies, this is why they are grouped by currency in the summary page.
The columns of the grid that contain the data are the following:
- Supplier
- Supplier Entity
- Plant
- PO Line
- PO Value
- On time %
- In Full %
- OTIF %
- LTA%
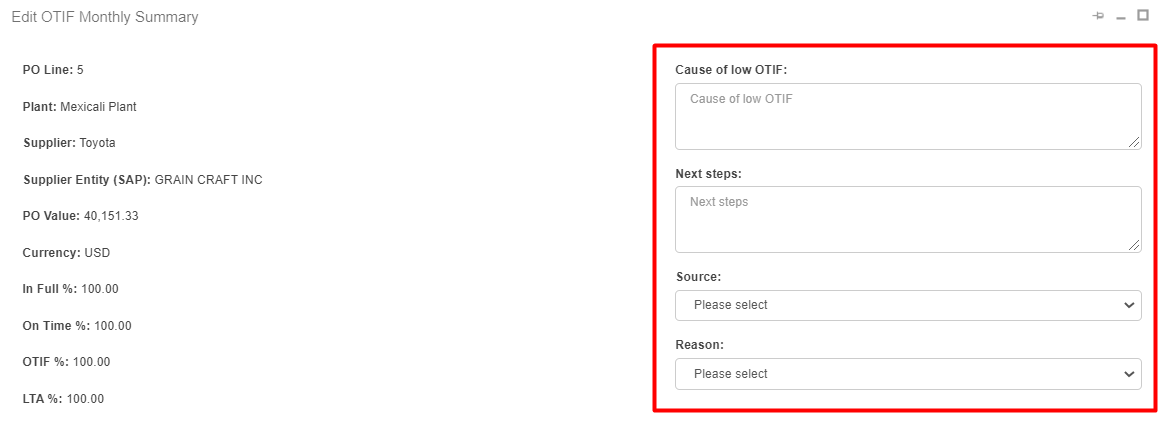
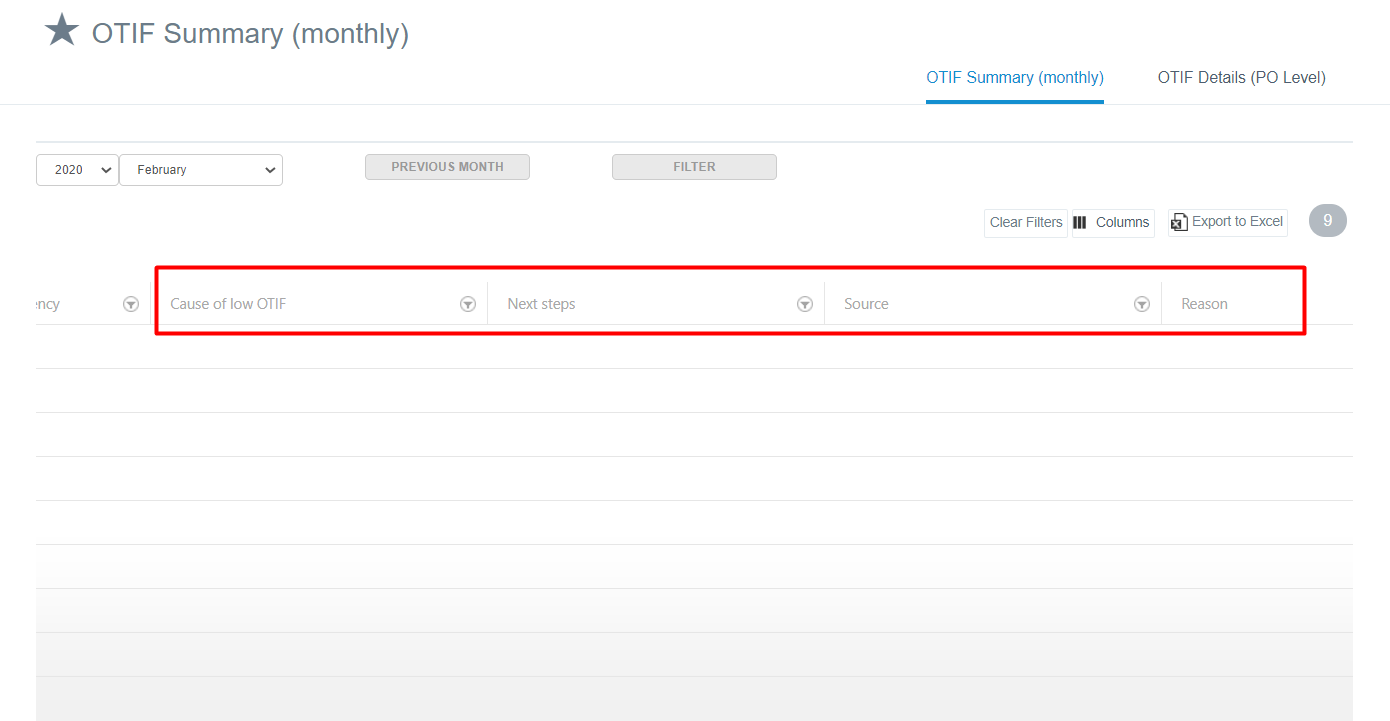
There are 4 more columns which are available for the users to fill in for every delivery:
- Cause of low OTIF
- Next steps
- Source
- Reason
On the grid, users will be able to perform the following standard activities:
- Filter
- Search
- Sort
- Export to Ms Excel
In every summary row, users can:
- View OTIF details: at the View pop-up, users are able to view the aggregated details of all the deliveries of a specific supplier entity to one plant
- Edit the summary of the deliveries
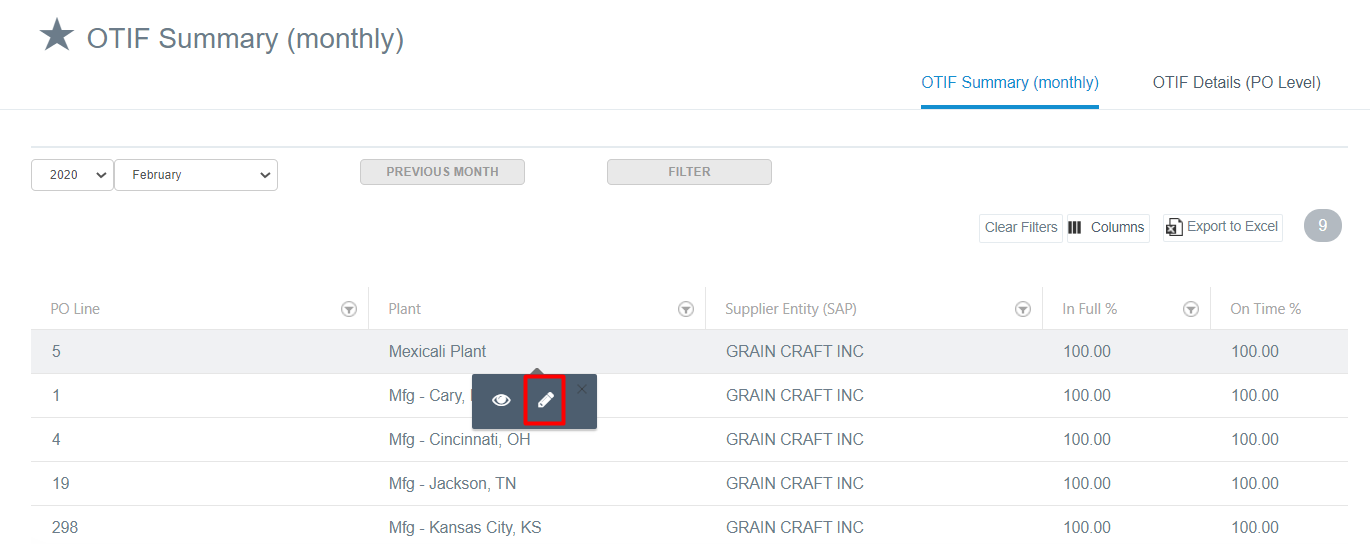
Users are able to add their comments for each of the fields Cause of low OTIF, Next steps, Source, Reason.